SOURCE results
Ordinal gait assessment after spinal cord injury
73 animals · 162 visits · 24 features
Ordinal XGBoost with animal-grouped nested cross-validation. One T9 experiment; injured, untreated controls.
Updated
Publication status
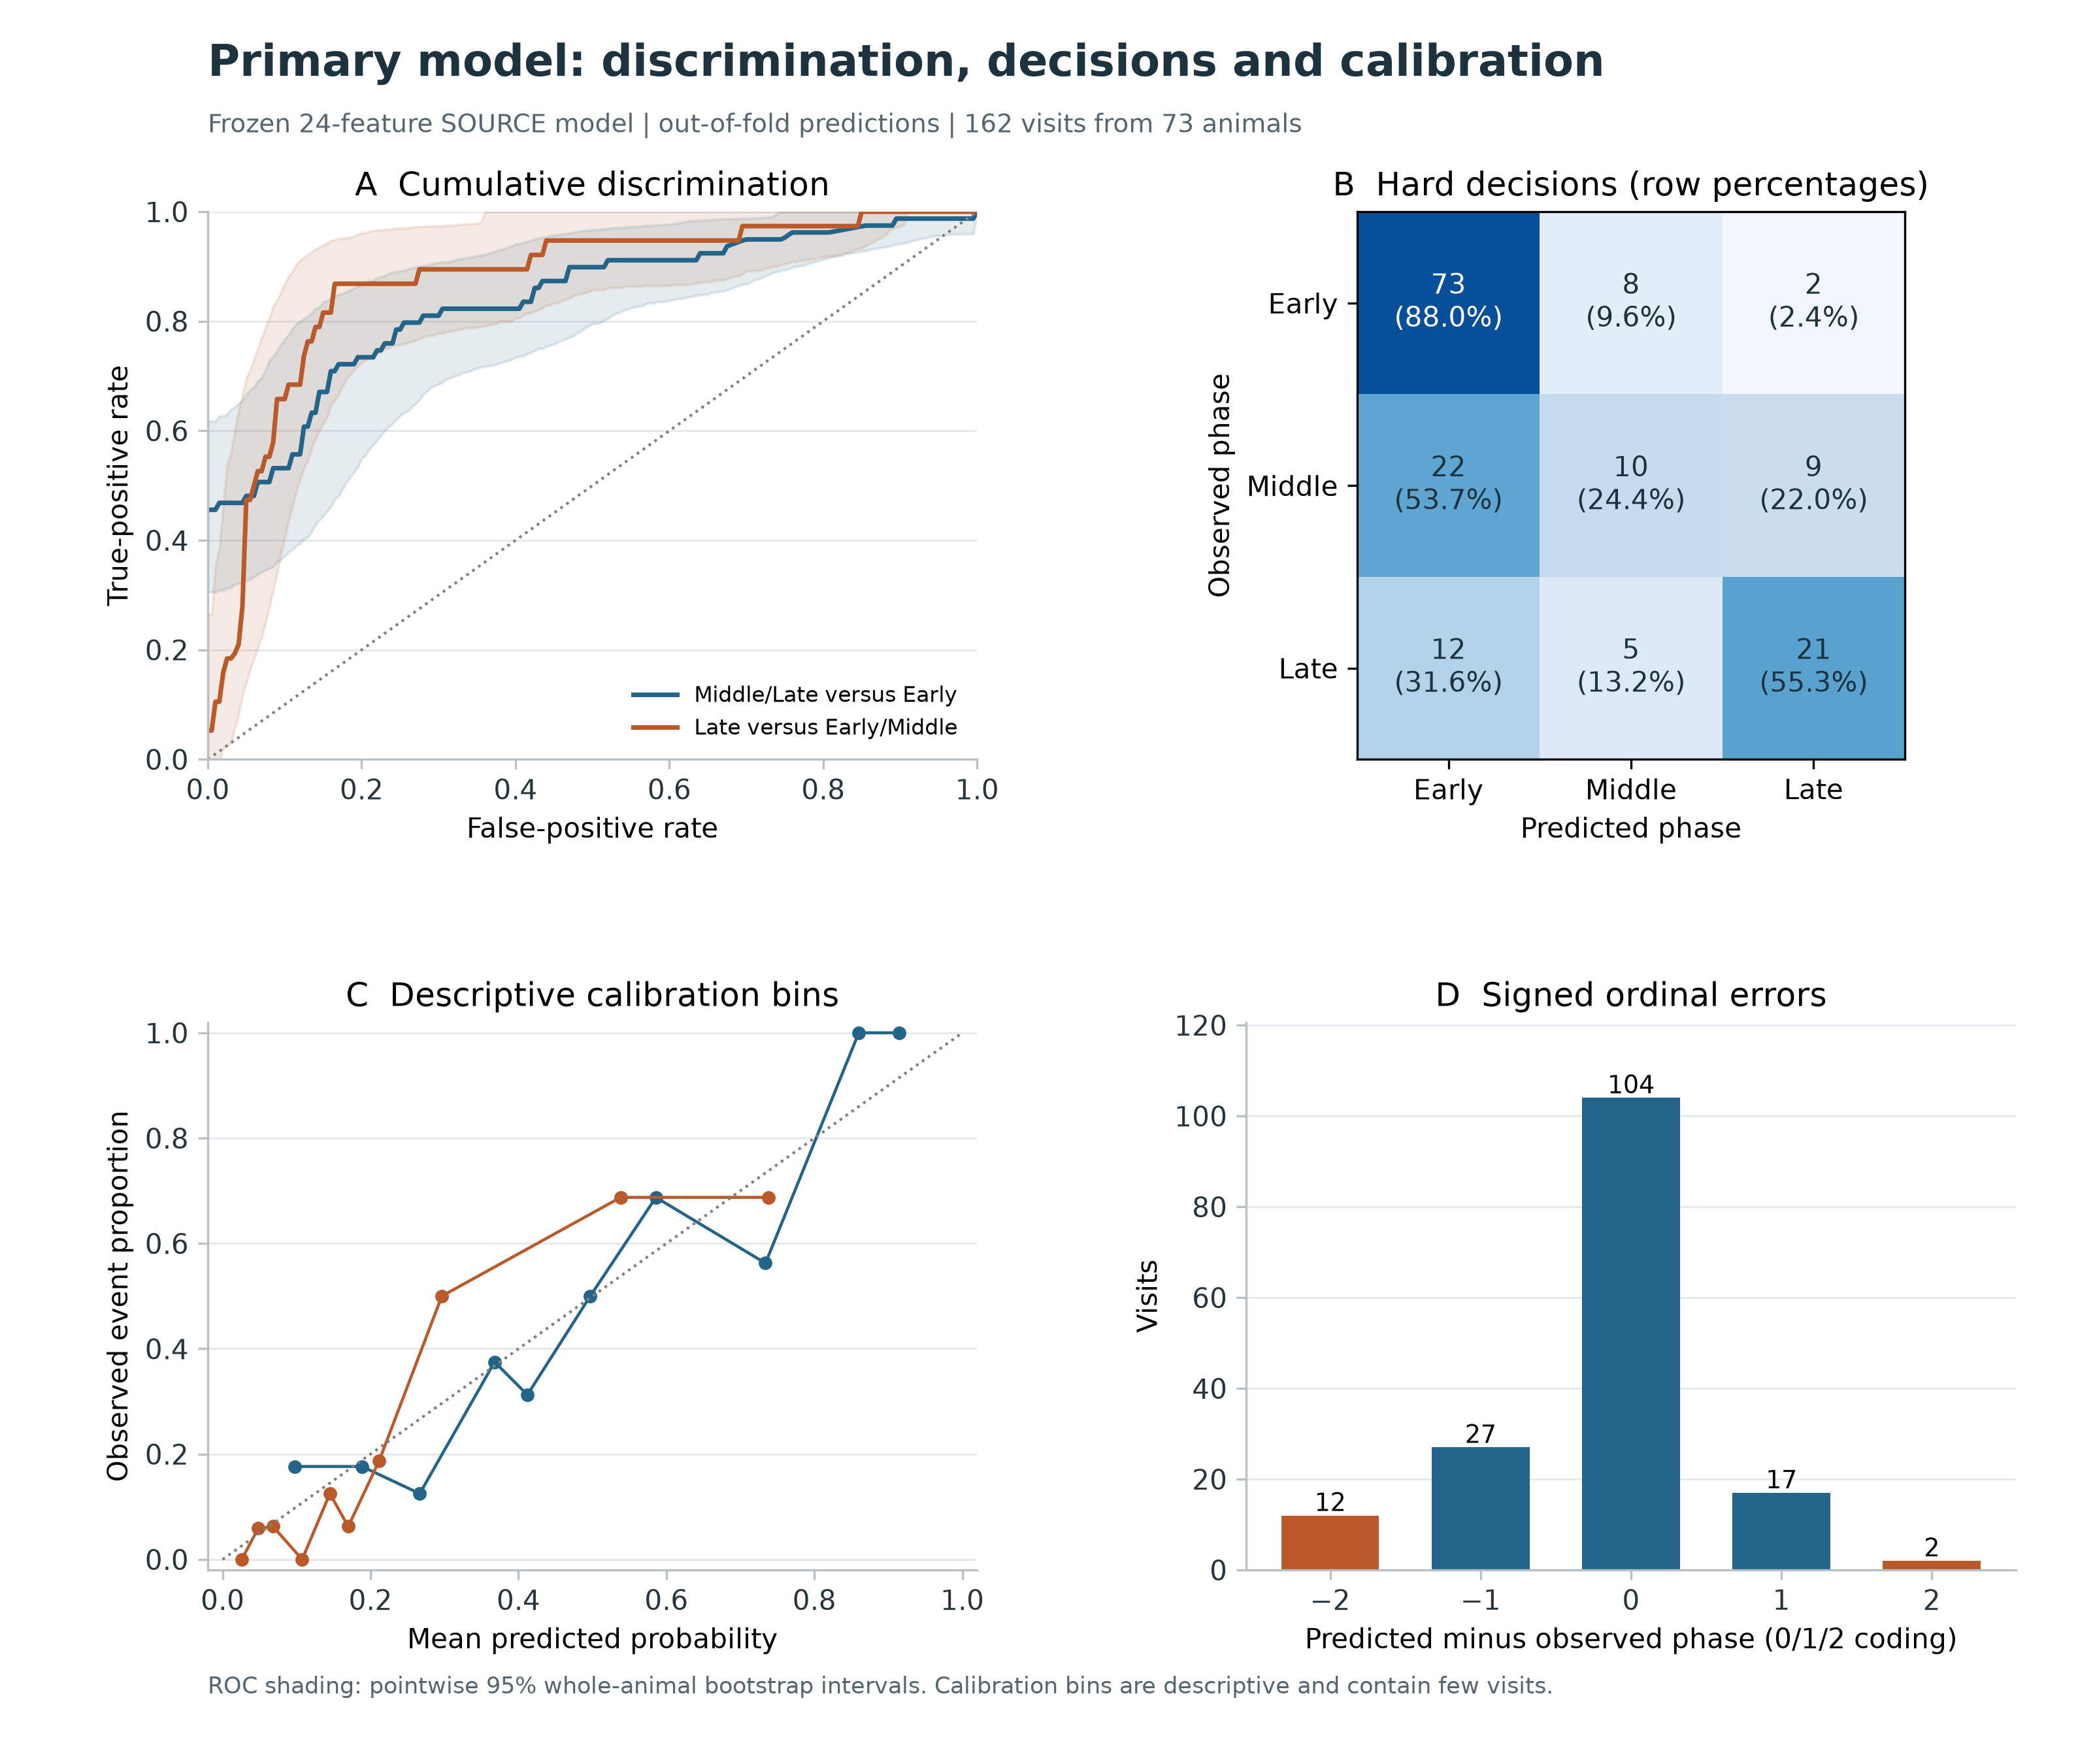
AUROC 0.854: discrimination across ordered phases
The original primary metric shows useful ranking of postoperative phases in held-out animals. Exact three-phase assignment is less reliable; these measures answer different questions.
- Mean cumulative AUROC · primary endpoint
- 0.854
95% CI 0.796 to 0.903
Ranking across two ordered phase boundaries - Balanced accuracy
- 55.9%
Mean recall across the three assigned phases
- Middle-phase recall
- 24.4%
10 of 41 Middle visits correctly assigned
AUROC evaluates Middle/Late versus Early and Late versus Early/Middle, averaging the two boundary AUROCs. It assesses probability ranking without selecting a classification threshold. Balanced accuracy uses the single highest-probability phase assigned to each visit; AUROC is not the percentage of visits classified correctly.
Why the Middle phase is difficult to assign
Recovery may progress along a continuum, while the labels divide postoperative time into discrete windows. Transitional gait patterns in the Middle phase may resemble either neighboring phase. Of 41 Middle visits, 22 were classified as Early, 10 as Middle and nine as Late. Useful boundary ranking can therefore coexist with weak Middle-phase recall.
This is a plausible explanation, not proof that biological continuity caused the errors or that low Middle recall is inevitable. Calibration, limited sample support, missing measurements and model limitations may also contribute. Fourteen of 162 visits were misclassified directly between Early and Late. Independent functional outcomes are needed to validate a continuous recovery measure, and within-phase resolution remains uncertain.
| Endpoint | Estimate | 95% interval |
|---|---|---|
| Mean cumulative AUROC | 0.854 | 0.796 to 0.903 |
| Balanced accuracy | 55.9% | 48.0% to 63.8% |
| Middle-phase recall | 24.4% | 11.1% to 40.0% |
| Ranked probability score | 0.141 | 0.118 to 0.163 |
| Training-prevalence reference RPS | 0.215 | 0.195 to 0.234 |
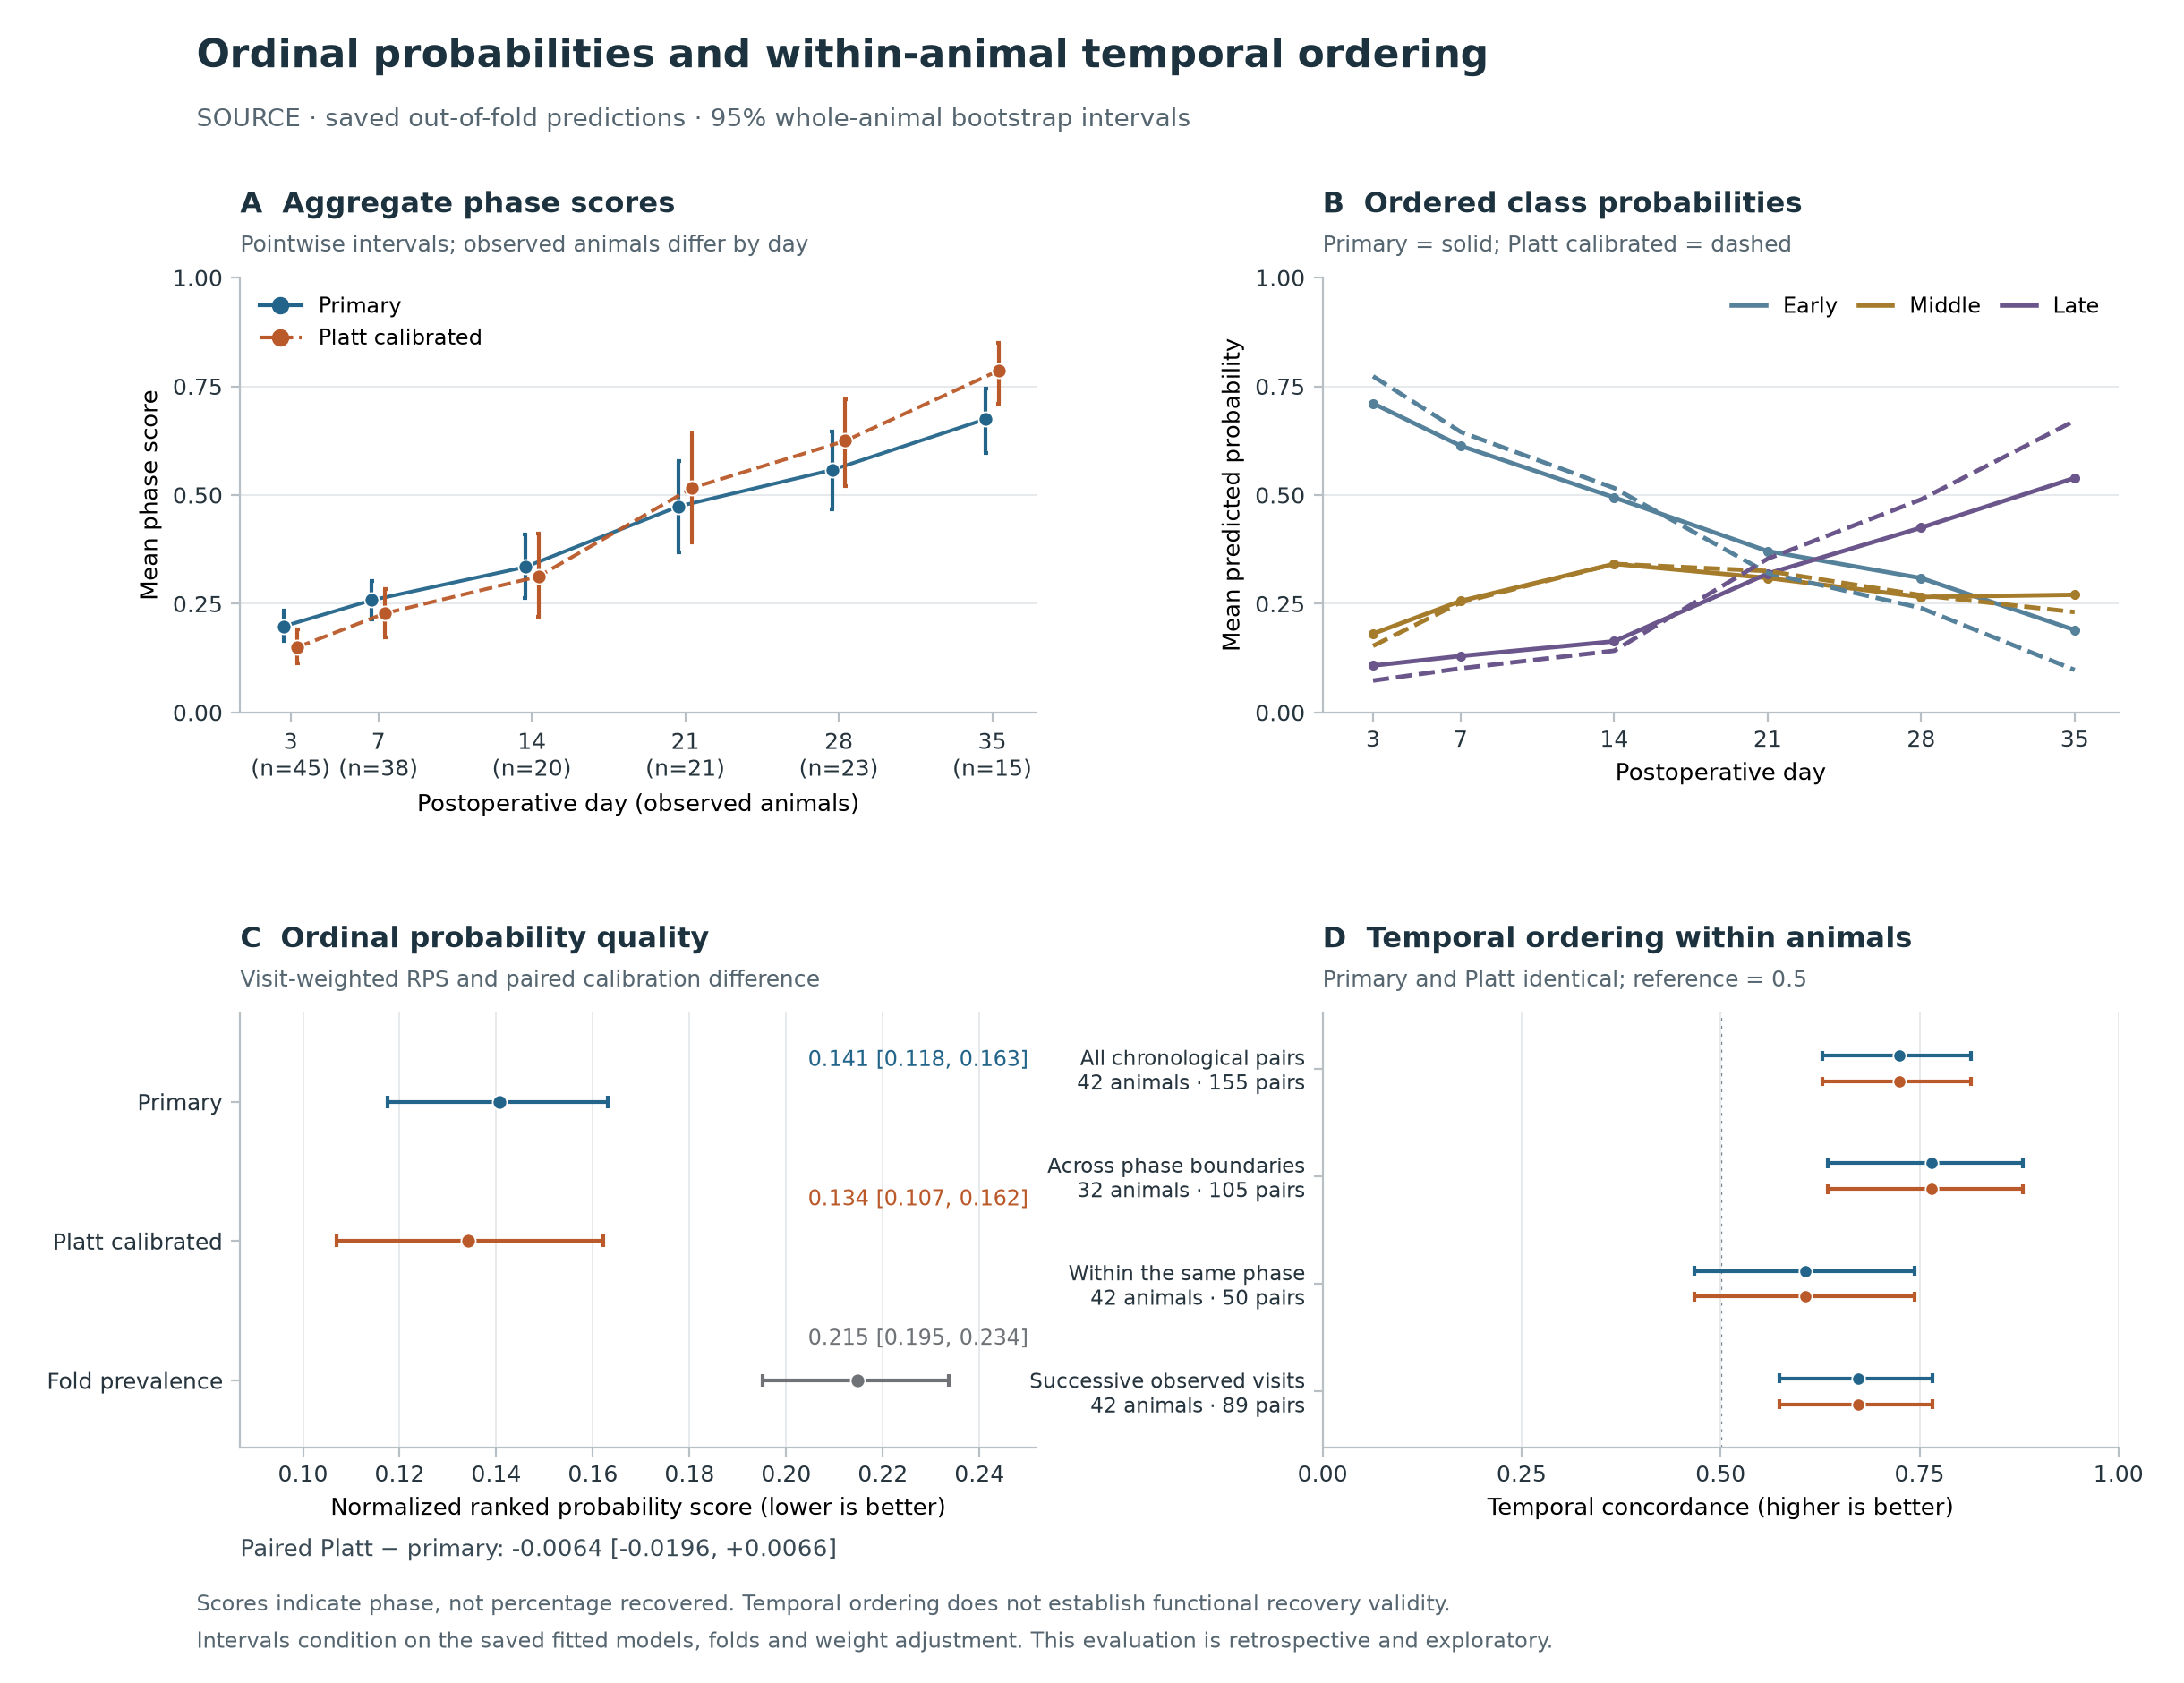
| Within-animal temporal concordance | 0.725 | 0.628 to 0.814 |
| Within-phase temporal concordance | 0.607 | 0.467 to 0.743 |
Lower ranked probability score (RPS) indicates better probability quality. Concordance gives each eligible animal equal weight; 0.5 is the ordering reference. AUROC and balanced accuracy retain their original intervals; other rows use the later saved-prediction evaluation. All intervals use whole-animal bootstrap samples and condition on the fitted models.
Sensitivity to assigned weight adjustment
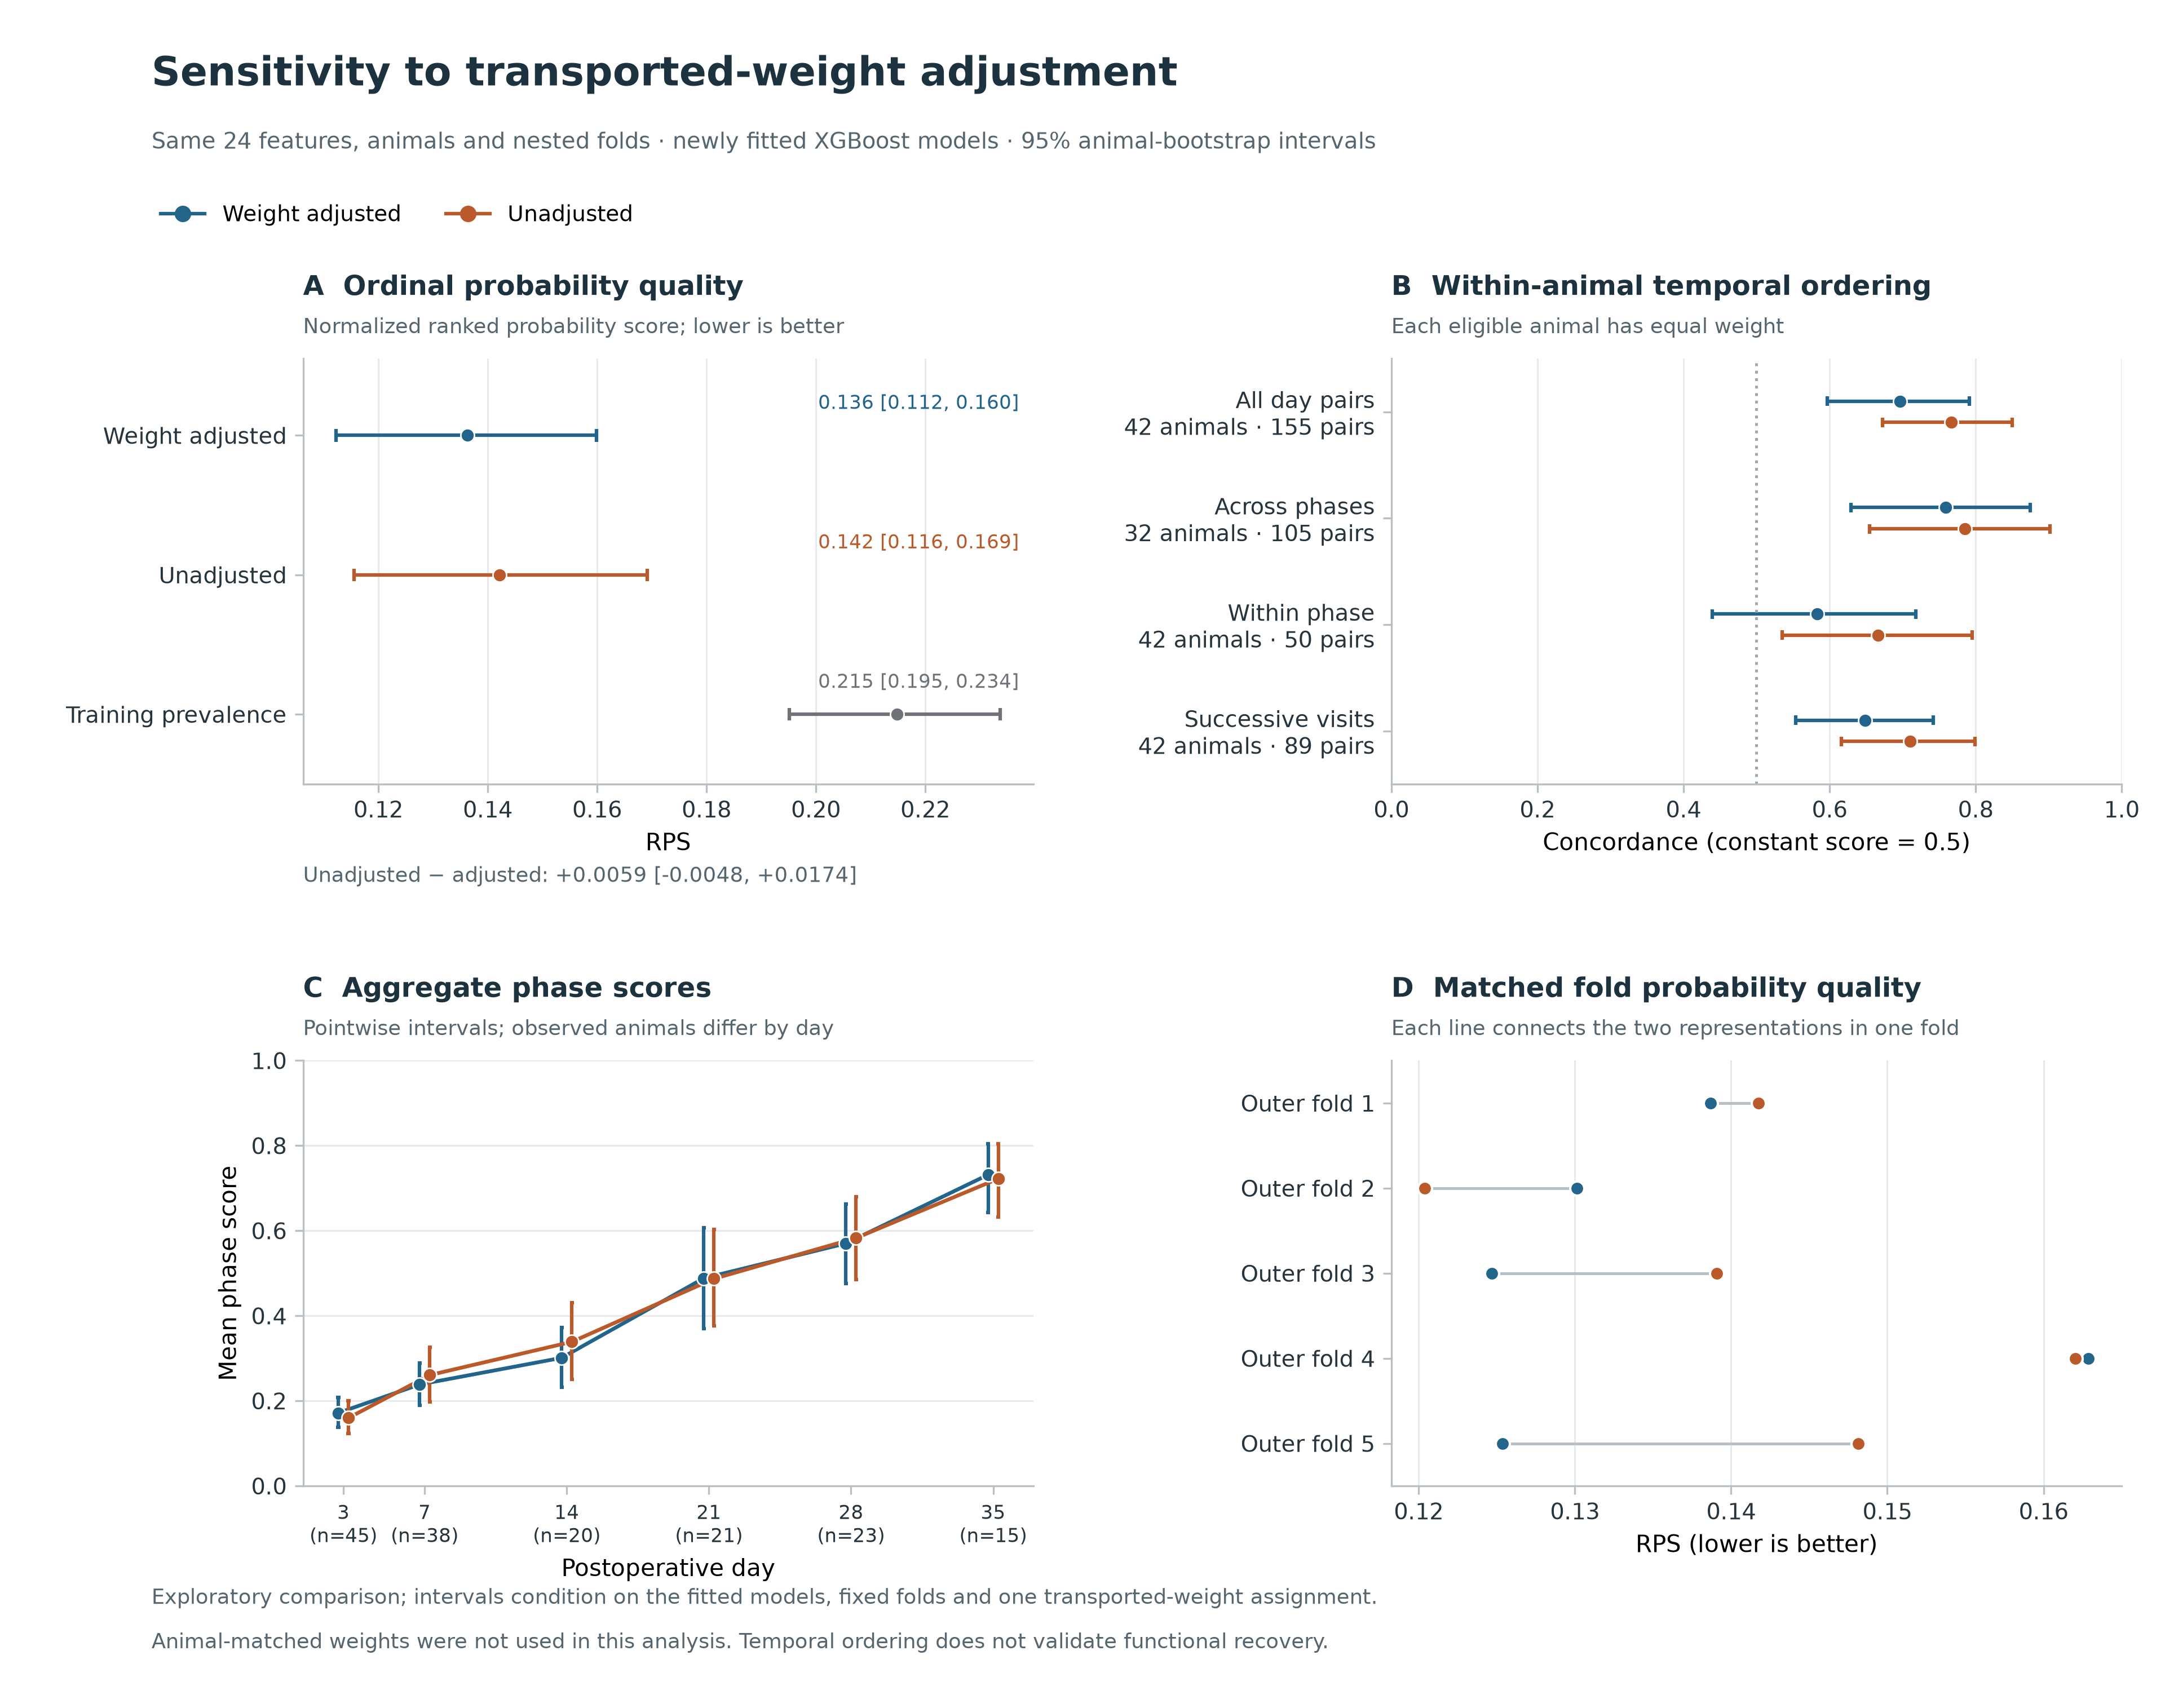
Two contemporaneous refits used the same animals, features and nested folds. Removing weight adjustment modestly worsened probability quality and improved temporal ordering in the point estimates. Both primary difference intervals include zero.
| Endpoint | Adjusted | Unadjusted | Difference (95% interval) |
|---|---|---|---|
| Visit-weighted RPS | 0.136 | 0.142 | 0.006 (-0.005 to 0.017) |
| Within-animal temporal concordance | 0.697 | 0.767 | 0.070 (-0.004 to 0.154) |
Difference = unadjusted minus adjusted. The adjusted refit is distinct from the original primary model. Intervals containing zero do not establish equivalence. Assigned weights came from control records within the same experiment and were not matched measurements of each recipient animal.
Aggregate figures
Original primary performance
Probabilities and within-animal ordering
Matched weight sensitivity
Evidence tables
| Stratum | Phase | Visits | Animals | Weight mean (SD), g | Weight range, g | Weight support / note |
|---|---|---|---|---|---|---|
| All included visits | All | 162 | 73 | — | — | Post-baseline controls |
| Day 3 | Early | 45 | 45 | 228.7 (24.7) | 192.7–284.6 | Donor-supported |
| Day 7 | Early | 38 | 38 | 209.7 (22.9) | 174.7–271.3 | Donor-supported |
| Day 14 | Middle | 20 | 20 | 208.7 (33.2) | 167.3–291.5 | Donor-supported |
| Day 21 | Middle | 21 | 21 | 242.7 (26.8) | 202.7–305.5 | Donor-supported |
| Day 28 | Late | 23 | 23 | 248.9 (27.3) | 212.1–309.3 | Donor-supported |
| Day 35 | Late | 15 | 15 | 259.1 (34.4) | 216.7–327.3 | Extrapolated |
| Phase total | Early | 83 | 57 | — | — | Animal counts overlap across phases |
| Phase total | Middle | 41 | 32 | — | — | Animal counts overlap across phases |
| Phase total | Late | 38 | 23 | — | — | Animal counts overlap across phases |
Weights are assigned analysis values derived from control records within the same experiment, not linked measurements for the recipient gait animals. Day 35 uses donor-specific log-linear extrapolation from days 21–28.
No missing visits were imputed. Phase-specific animal counts overlap; the cohort contains 73 unique animals.
Thirty-one animals have one visit; 42 animals support longitudinal analysis.
What the findings support
The relatively high primary AUROC supports ordinal phase discrimination. The lower balanced accuracy and Middle-phase recall limit exact phase assignment. The score describes expected postoperative phase; temporal concordance measures chronological ordering. Independent functional measurements are still needed to validate it as a biological recovery measure.
- All evaluation is internal to one selected experiment. Earlier dataset screening and the additional analyses make the findings exploratory.
- Missingness was phase-dependent: 39.5% of engineered values were missing overall, including 58.3% in Early, 26.4% in Middle and 12.6% in Late phase. Medians were learned within each training partition.
- Intervals exclude full model-development, alternative-fold and donor-assignment uncertainty. Only 42 animals contributed repeated visits.
- A SOURCE feature-saturation curve was discussed but has not been run. No reduced feature panel or optimum feature count is claimed.